Unlocking Insights: Best Practices for Business Intelligence Software Reporting
In today’s data-driven landscape, businesses are drowning in information. Raw data, however, is useless without effective analysis and presentation. This is where Business Intelligence (BI) software and its reporting capabilities become critical. This article delves into the best practices for business intelligence software reporting, equipping you with the knowledge to transform raw data into actionable insights and drive strategic decision-making. The right approach to reporting can mean the difference between informed decisions and missed opportunities. We will explore how to leverage BI software to create compelling reports that resonate with your audience.
Understanding the Significance of BI Reporting
Business intelligence software reporting is more than just generating charts and graphs. It’s about communicating complex information in a clear, concise, and visually appealing manner. Effective reporting helps stakeholders understand performance, identify trends, and make data-backed decisions. This ultimately leads to improved efficiency, increased profitability, and a competitive advantage. The process of reporting is crucial for aligning business goals with actual outcomes.
Defining Your Reporting Objectives
Before diving into the technical aspects of report creation, it is essential to define your objectives. What questions do you need your reports to answer? Who is your target audience, and what are their specific needs? Understanding these aspects will guide your report design and content. Consider the following:
- Identify Key Performance Indicators (KPIs): Determine the metrics that are most important to your business goals.
- Define the Audience: Tailor the reports to the specific needs and technical expertise of your audience.
- Establish Reporting Frequency: Decide how often reports need to be generated (daily, weekly, monthly, quarterly).
- Set Clear Goals: Define the specific outcomes you want to achieve with your reports.
Choosing the Right BI Software
The market offers a wide array of business intelligence software solutions. Selecting the right one is crucial for effective reporting. Consider the following factors:
- Data Integration: The software should seamlessly integrate with your existing data sources.
- Reporting Capabilities: Ensure the software offers the visualizations and functionalities you need.
- User-Friendliness: The software should be easy to use and navigate.
- Scalability: The software should be able to handle your current and future data volumes.
- Cost: Consider the total cost of ownership, including licensing and implementation.
[See also: Choosing the Right BI Software for Your Needs]
Designing Effective Reports
Report design is a key element in making data accessible and understandable. A well-designed report is visually appealing and easy to interpret. Here are some key design principles to follow:
- Keep it Simple: Avoid clutter and focus on the most important information.
- Use Visualizations Effectively: Choose the right chart types to represent your data.
- Use Color Strategically: Use color to highlight key information and trends.
- Provide Context: Include clear labels, titles, and annotations to explain the data.
- Maintain Consistency: Use a consistent design and layout across all reports.
Selecting the Right Visualizations
Visualizations are the heart of a good report. They transform raw data into meaningful insights. Choosing the right visualization type is critical for effective communication. Consider these options:
- Bar Charts: Ideal for comparing categorical data.
- Line Charts: Best for showing trends over time.
- Pie Charts: Useful for showing proportions of a whole. (Use sparingly)
- Scatter Plots: Good for showing the relationship between two variables.
- Heatmaps: Excellent for visualizing large datasets and identifying patterns.
Data Quality and Accuracy
The value of your reports is directly related to the quality of your data. Data accuracy is paramount for reliable insights. Here’s how to ensure data quality:
- Data Validation: Implement data validation rules to prevent errors.
- Data Cleansing: Regularly clean and correct data errors.
- Data Governance: Establish data governance policies and procedures.
- Data Auditing: Regularly audit your data to identify and address issues.
Automating the Reporting Process
Automation streamlines the reporting process, saving time and resources. Most business intelligence software offers automation features. Automate repetitive tasks like data extraction, report generation, and distribution. This allows you to focus on analysis and insights. Automation reduces the risk of errors. It also ensures consistency across all reports.
Report Distribution and Communication
Once you have created your reports, it is essential to distribute them effectively. The method of distribution depends on your audience and the nature of the report. Consider these options:
- Email: Send reports directly to stakeholders via email.
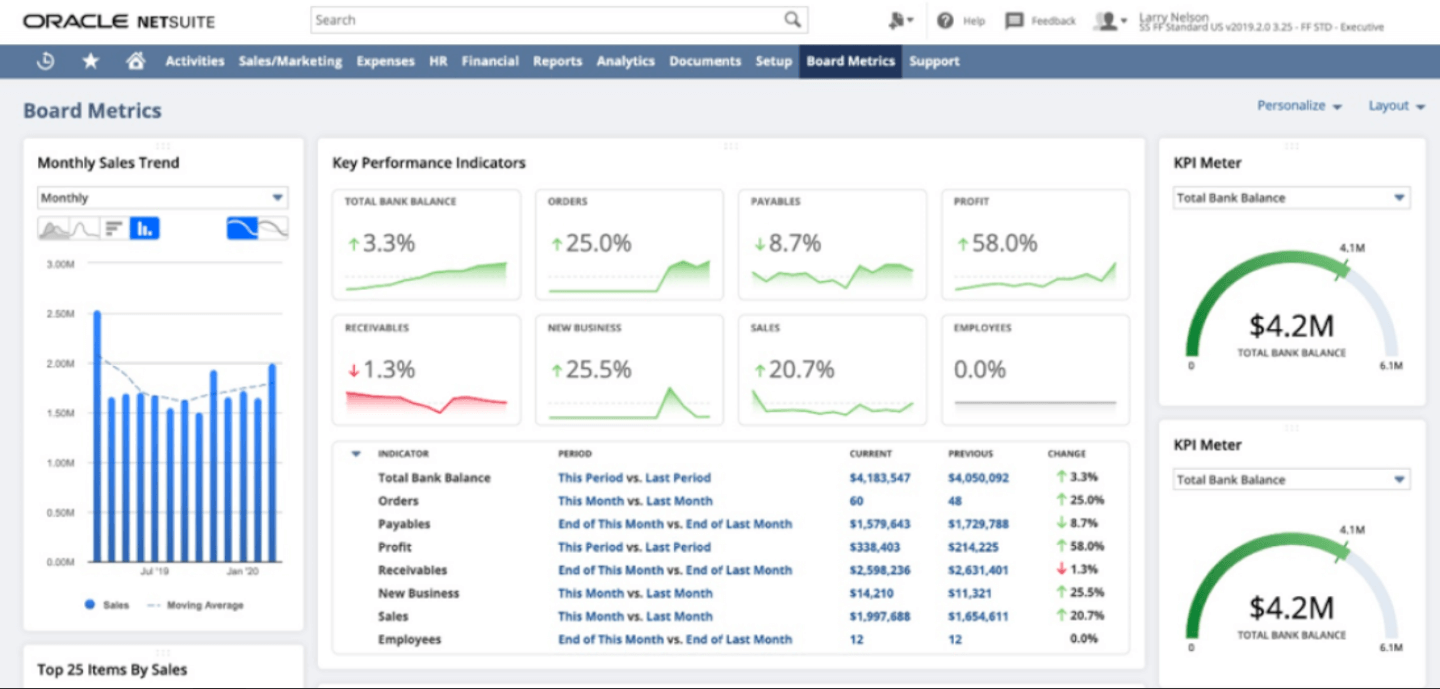
- Dashboards: Create interactive dashboards that users can access online.
- Scheduled Reports: Automate the delivery of reports at regular intervals.
- Collaboration Tools: Integrate reports with collaboration platforms.
Analyzing and Interpreting Reports
Creating the reports is only half the battle. The other half is analyzing and interpreting the data to gain valuable insights. This involves:
- Identifying Trends: Look for patterns and trends in the data.
- Comparing Data: Compare data across different periods or groups.
- Investigating Anomalies: Investigate any unusual data points.
- Drawing Conclusions: Based on your analysis, draw conclusions and make recommendations.
This is a critical step for driving actionable insights and making informed decisions. Proper analysis is the key to understanding the story that data tells.
Ensuring Report Security
Data security is a major concern. Protect sensitive data within your reports. Implement the following security measures:
- Access Controls: Restrict access to reports based on user roles and permissions.
- Data Encryption: Encrypt sensitive data to protect it from unauthorized access.
- Regular Audits: Regularly audit your security measures.
- Compliance: Ensure compliance with relevant data privacy regulations.
Training and Education
Investing in user training is essential for maximizing the value of your business intelligence software reporting. Provide training on:
- Software Features: Train users on the software’s features and functionalities.
- Report Creation: Train users on how to create effective reports.
- Data Analysis: Teach users how to analyze and interpret data.
- Best Practices: Educate users on best practices for business intelligence software reporting.
Continuous Improvement
Reporting is an ongoing process. Continuously evaluate and improve your reports. Seek feedback from your audience. Regularly review and update your reports. Adapt to changing business needs. Keep the reporting process dynamic. Always be looking for ways to improve.
Conclusion
Mastering the best practices for business intelligence software reporting is essential for any business seeking to leverage data effectively. By following these guidelines, you can transform raw data into actionable insights. You can drive better decision-making and achieve your business goals. Remember to prioritize data quality, choose the right software, and design visually appealing reports. Embrace automation and continuous improvement. This will help you unlock the full potential of your data.
By implementing these best practices for business intelligence software reporting, you can transform your data into a powerful asset. You can make informed decisions and achieve a competitive edge. Effective reporting is a journey, not a destination. Continuously refine your approach. Stay up-to-date with the latest trends. And your business will thrive in the data-driven world. The implementation of business intelligence software and the subsequent reporting is critical for success.
